


Despite government claims to the contrary, the data paint a starkly different reality.
By JC Mercado
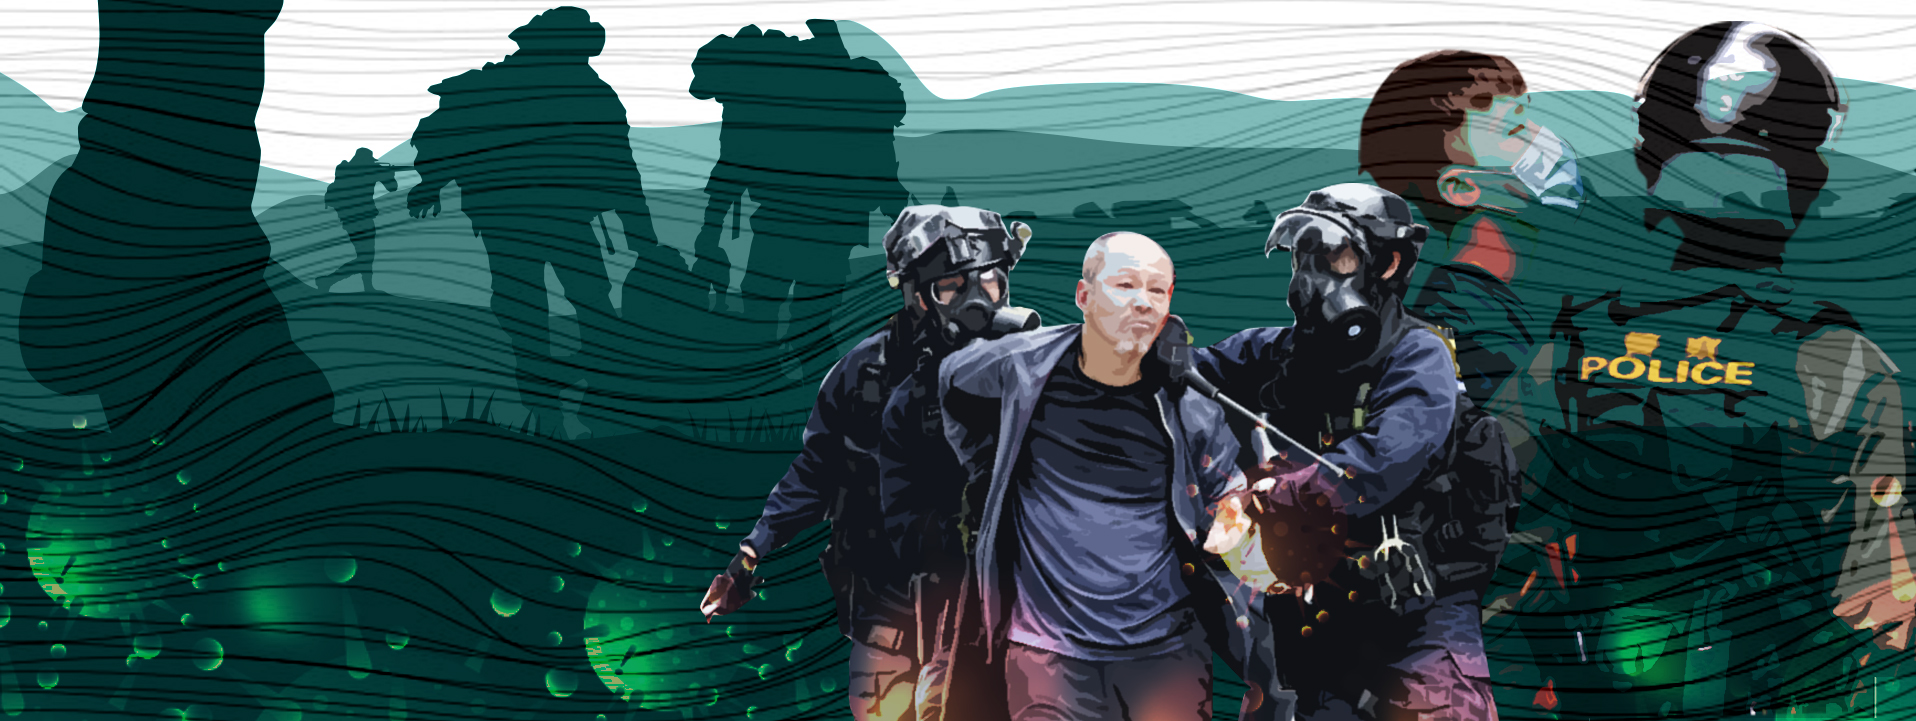
[dropcap font=”” size=”100px” background=”” color=”” circle=”0″ transparent=”0″]A[/dropcap]t the rate human rights violations (HRVs) are being committed in the guise of averting the spread of the dreaded Covid-19 disease, nations are no longer just hostage to the coronavirus. Increasingly, they are pawns in repressive regimes controlled by leaders with an authoritarian streak.
For these leaders, the exercise of emergency powers and the imposition of highly militarized lockdowns are purportedly necessary measures to quell the pandemic. In reality, however, these measures serve their selfish interests more than those of the people they are sworn to serve.
A careful perusal of data shows that violations are more likely to be committed in countries with more stringent lockdowns. Moreover, some sectors are more targeted than others.
A sordid reality
In April, United Nations (UN) Secretary General Antonio Guterres described the Covid-19 pandemic as “a human crisis that is fast becoming a human rights crisis.”
UN High Commissioner for Human Rights Michelle Bachelet issued a warning that “emergency powers should not be a weapon governments can wield to quash dissent, control the population, and even perpetuate their time in power.”
Even rights advocates and watchdogs have not been remiss in flagging HRVs or state-perpetrated attacks on civilians.
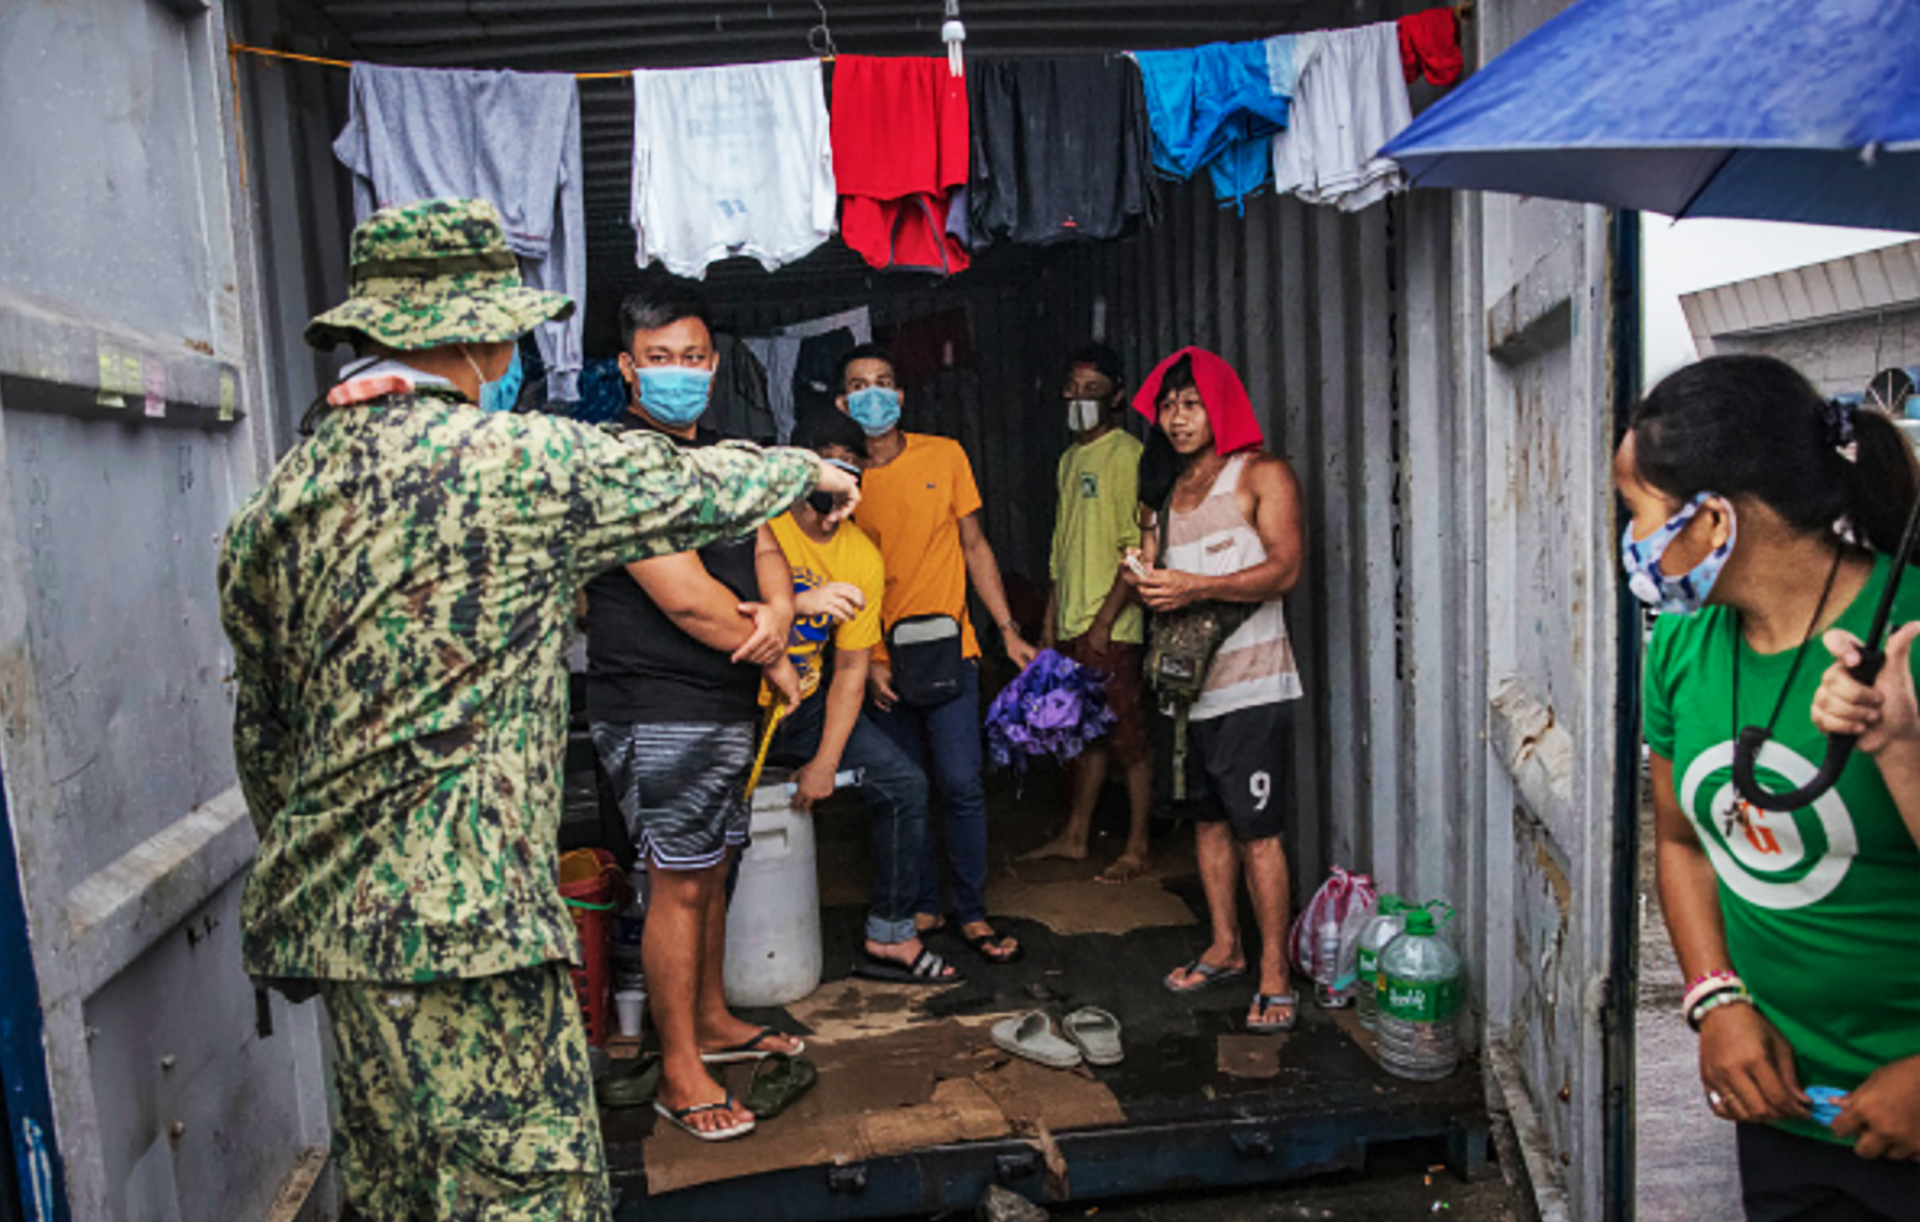
There is certainly no dearth of examples to illustrate this sordid reality. A 63-year old Filipino farmer was gunned down by cops at a checkpoint in Agusan del Norte, Southern Philippines, for allegedly trying to attack the policemen after being told to wear a face mask.
“Shoot them dead,” was President Rodrigo Duterte’s stern order to the country’s troops in one of his late-night press conferences. He was referring to quarantine violators.
In May, horrific images of police brutality in the Indian-controlled Jammu and Kashmir region emerged online amid restricted Internet access and the absence of the Jammu and Kashmir State Human Rights Commission, which closed in October 2019. On May 9 alone, at least 200 workers crossing the bridge at Lakhanpur city were beaten up by police forces in India for supposedly violating lockdown rules.
“We have seen many States adopt justifiable, reasonable, and time-limited measures. But there have also been deeply worrying cases where governments appear to be using Covid-19 as a cover for human rights violations, further restricting fundamental freedoms and civic space, and undermining the rule of law,” Bachelet said.
In Asia, 16 countries have imposed lockdowns, while seven states have granted emergency powers to their leaders to date. Persisting concerns around HRVs amid the pandemic have since hounded the region.
Numerous human rights groups have initiated petitions and appeals to governments to ensure that measures to contain Covid-19 do not come at the cost of people’s civil liberties.
“Blunt tools”
Experts at the World Health Organization recommended the adoption of movement restrictions and physical distancing measures in countries with community transmission. However, they noted that these “blunt tools” must be implemented with the “understanding, consent, and participation of communities, and based on the principle of doing no harm.”
Social scientists note that policies of quarantines may feed the rise of authoritarianism in some countries, giving incentives to state leaders to impose stricter and longer lockdowns than necessary.
Initial studies suggest, too, that prolonged lockdowns can be tied to an increase in economic decline and mass layoffs, hitting underprivileged populations worse. They also argue that the evidence for decreasing case-fatality ratios as responses become stricter is simply lacking.
As Asian countries are hit differently by the pandemic, most of them remain in varying modes of quarantine. The severity of lockdowns is expected to match Covid-19 case fatality ratios. However, data in the region show that there is more to these measures than meets the eye.
Note: Hover the cursor over the boxes to view the country data.
The Stringency Index is an initiative of the Oxford University’s Blavatnik School of Government. The institution is maintaining a database of pandemic-response policies and using it to derive an index of the overall stringency of the measures.
This box plot can be interpreted thus: The line represents the median or average strictness of lockdowns. Red boxes represent countries with the highest average scores (most strict at 75-100); purple for intermediate scores (strict at 50-75); and blue for lowest scores (more relaxed at 0-50). The box length represents the consistency in policy over the first 150 days after lockdown. The longer the box, the more inconsistent or discriminatory the policies implemented.
Stringency scores
Several countries in Asia were inconsistent in their lockdown policies and the policies’ strict implementation, at least in the first 150 days of the measure’s imposition, based on the data from Oxford University’s Stringency Index. The Index measures government responses to the novel coronavirus — lockdowns, travel restrictions, and flight bans — and scores them based on their stringency or the extent and harshness of their implementation.
Myanmar, despite recording an average of one new Covid-19 case per day during the period, has implemented very rigid lockdown policies, with an average score of 80.56. In contrast, Japan, which has recorded more cases, has an average score of 40.47, the lowest in the region.
Lockdowns in most countries in South Asia and some countries in Southeast Asia — like the Philippines, Myanmar, and Malaysia — are generally harsher and more inconsistent or discriminatory compared to others (represented by the spread of the box). In the Philippines, for example, powerful politicians have gotten away with violating lockdown rules while the poor bear their brunt.
While a level of flexibility is expected in emergency response scenarios, the graph shows that countries which kept Covid-19 casualties at a minimum have more consistent policies (shorter boxes) than those with more coronavirus cases.

Countries with more stringent and inconsistent lockdowns have recorded more human rights violations.
![]()
While lockdowns restrict freedom of movement in varying degrees, they should not in any way hamper civil and political rights. Yet, HRVs, as shown by The Armed Conflict Location & Event Data (ACLED) Project, suggest that in some countries in Asia, they do.
Globally, the first three months of lockdowns alone have yielded a 34 percent year-on-year increase in state-perpetrated attacks, based on ACLED data. At least 347 individuals have been killed, allegedly by state actors, during the period Feb. 1 to Sept. 1 this year in 673 incidents recorded in South, East, and Southeast Asia. These do not include state-induced events such as the Bharatiya Janata Party-related mob violence against Muslims in India and anti-drug vigilantes in the Philippines.
A comparison of the average stringency scores of the countries to recorded HRVs in the region shows an emerging pattern: Countries with more stringent and inconsistent lockdowns have recorded more human rights violations.
Note: Hover the cursor over the dots to view the country data.
This bar graph represents the average (median) stringency index score of the indicated country in the first 150 days since the first case of Covid-19 was recorded. On the other hand, the dots represent the number of HRV events as recorded in the same period.
Militarized responses and stricter lockdown measures were also evident in the countries that scored low in terms of human rights protection, such as the Philippines, India, and China. Unsurprisingly, the absence of legal and progressive safeguards has led to more HRVs.
Note: Hover the cursor over the dots to view the countries represented, and over the diagonal line to view the country data.
At least 51% of the persistence of state-perpetrated HRVs corresponds to the level of legal and progressive human rights protections in the country.
Data sources: Human Rights Protection scores come from Latent Human Rights Protection Scores Version 3 (v3.01, 2019-05-28), first developed by Schnakenberg and Fariss (2014) and subsequently updated by Fariss (2019). The scores are constructed from human rights reports from governments, UN bodies, and international NGOs like Amnesty International.
HRV events are from ACLED’s database (September 2018 to September 2020), transformed with natural logarithm to account for outliers and normalize distribution. Significance (p-value) is very high (less than 0.005 at 1.23646E-19).
Meanwhile, the governments with higher human rights protection scores — such as Uruguay, Dominica, and Namibia — have pushed for a public health approach to the pandemic.
Note: Hover the cursor over the dots to view the countries represented, and over the horizontal line to view the country data.
Prioritizing Stringent Measures over Health Response is a transformed version of OxCGRT indices calculated by comparing Health Response Index and Stringency Index. A score above 1 means health response scores are higher than stringent measures, while a score less than 1 means the reverse.
Unabated killings
Drilling down on HRVs, a crackdown on vulnerable groups emerges from the data — some of them a continuation, others a new trend. Attacks against labor groups, fishers, farmers, and indigenous peoples happening during today’s global health scourge are more persistent than HRVs related to lockdown rules.
Worse, some of these abuses were done in the guise of lockdowns. Previously targeted groups — like the drug suspects in the Philippines, the indigenous peoples in Myanmar, and the activists and journalists in China — dominate the data landscape.
Note: Hover the cursor over the color-coded bars to view more data.
Data source: ACLED data from Feb. 1 to Sept. 1, 2020 in South, East, and Southeast Asian countries
However, new trends are also developing. The data show increasing attacks on labor groups in India, state-perpetrated violence against women in China, and a crackdown on West Papuan indigenous peoples in Indonesia.
In two separate cases in April and May in Uttar Pradesh and Gujarat, respectively, ordinary workers were beaten to death by police for allegedly violating lockdown rules.
Note: The “Exclude Drug Suspects’’ button was added to show a picture of the sectors without skewing the data from President Rodrigo Duterte’s “war on drugs.” Select and compare specific sectors using the dropdown menu.
Data source: ACLED data from Feb. 1 to Sept. 1, 2020 in South, East, and Southeast Asian countries
In the Philippines, more than a third of the recorded HRVs amid the lockdown involved drug suspects. It accounted for a whopping 179 out of 180 instances of drug-related killings in Asia during the period. Despite having one of the world’s longest and strictest lockdowns, the Philippines’ confirmed Covid-19 cases stood at 320,000 as of early October, making it the highest in Southeast Asia and among the top 20 countries in the world.
While there was a significant drop in recorded deaths in the infamous drug war of the Duterte regime in the first quarter of this year, it has picked up the pace since June. In September, Human Rights Watch cited official government data and reported that the police killed 50 percent more people between April and July 2020 than they did in the previous four-month period.
In the crosshairs
Civil society organizations have already reported an estimate of 27,000 drug-related extrajudicial killings in the country since Duterte took office in 2016.
Moreover, the crackdown against activists and journalists remains unabated. As heavy rain poured on the night of August 17, Zara Alvarez — a staunch human rights advocate and church aid worker — was gunned down by suspected state forces in Bacolod City, central Philippines. Alvarez is but the latest of a growing list of activists — 300 activists and counting — killed under the Duterte regime.
Meanwhile, a female petitioner was assaulted by cops at the Public Security Bureau in Xushui district, Hebei, China after her arrest on August 4. She was one of 39 protesters apprehended following a series of demonstrations related to land on the same day.
In June, two Pakistani journalists were arrested and tortured in southwestern Balochistan region by police and the Anti-Terrorism Force.
Activists and journalists continue to be in the crosshairs of the law in some countries. Apart from drug-related killings in the Philippines, at least a tenth of attacks against civilians amid lockdowns in selected Asian regions are directed towards activists and journalists.
Attacks against journalists are rampant in countries with higher Press Freedom Violation scores: China, Bangladesh, Singapore, and India.
Note: Hover the cursor over the dots to view the country data.
Data source: Press Freedom Violation Scores from Reporters Without Borders’ Press Freedom Index 2020
Peaceful protests
Still, despite many governments’ efforts to stifle opposition and dissent and attempts to discourage mass movements by banning public gatherings, a resurgence of protests in several countries has been observed since June.
Note: Hover the cursor over the graph to view the regional data.
Across Asia, the majority of protests seen this year remains generally peaceful, with only a handful marked by interventions by state forces. An even smaller number of these mass gatherings were characterized by violent dispersals.
Data source: ACLED monitoring
Note: Hover the cursor over the diagram to view the data.
Data source: The number of protests comes from ACLED data (based on Feb. 1 to Sept. 1, 2020 data compared to the same period in 2019). Peaceful protests are categorized as such when no violence or type of dispersal is involved. Protests with intervention means non-lethal violence and dispersal were involved.
Note: Hover the cursor over the horizontal bars to view the country data.
Data source: Data from ACLED (Feb. 1 to Sept. 1, 2020 compared to the same period in 2019)
India’s controversial 2019 Citizenship (Amendment) Act continues to be a major flashpoint in protests. Following a midyear lull, protests against the new law have intensified since July. Surpassing the previous year’s record, protests have erupted in South Korea as organizations call on liberal President Moon Jae-in to step down amid corruption and controversies around election-related fraud.
Regarding methodology, the data used in this analysis cover Feb. 1 to Sept. 1, 2020 to account for the first wave of lockdowns in South, East, and Southeast Asia. For the full datasets and data processing, see this Google Sheet. ●
JC Mercado has more than 10 years of data research and content writing experience. He is also a longtime peasant advocate and food sovereignty activist in the Philippines. He writes about human rights and rural people’s welfare in the Philippines and in Asia. Catch him on Twitter as @darnitjc.


